Appliance Portal
The Appliance Portal is the primary management UI for CoreDetection. It runs as coredetection-portal.service and proxies engine API calls so you never expose the raw detection API to browsers.
admin@local (change the password under Settings → Users).Navigation overview
| Section | Pages | Purpose |
|---|---|---|
| Operations | Dashboard, Attack History, Traffic Monitor | Live status, forensic history, flow analytics |
| Mitigation | BGP & Mitigation, FlowSpec, Blocklist | Peers, exporter map, FlowSpec rules, threat feeds |
| Settings | Detection, Notifications, System, Expert | Thresholds, alerts, updates, raw config.ini editor |
| Administration | Users, License | Portal accounts and license activation |
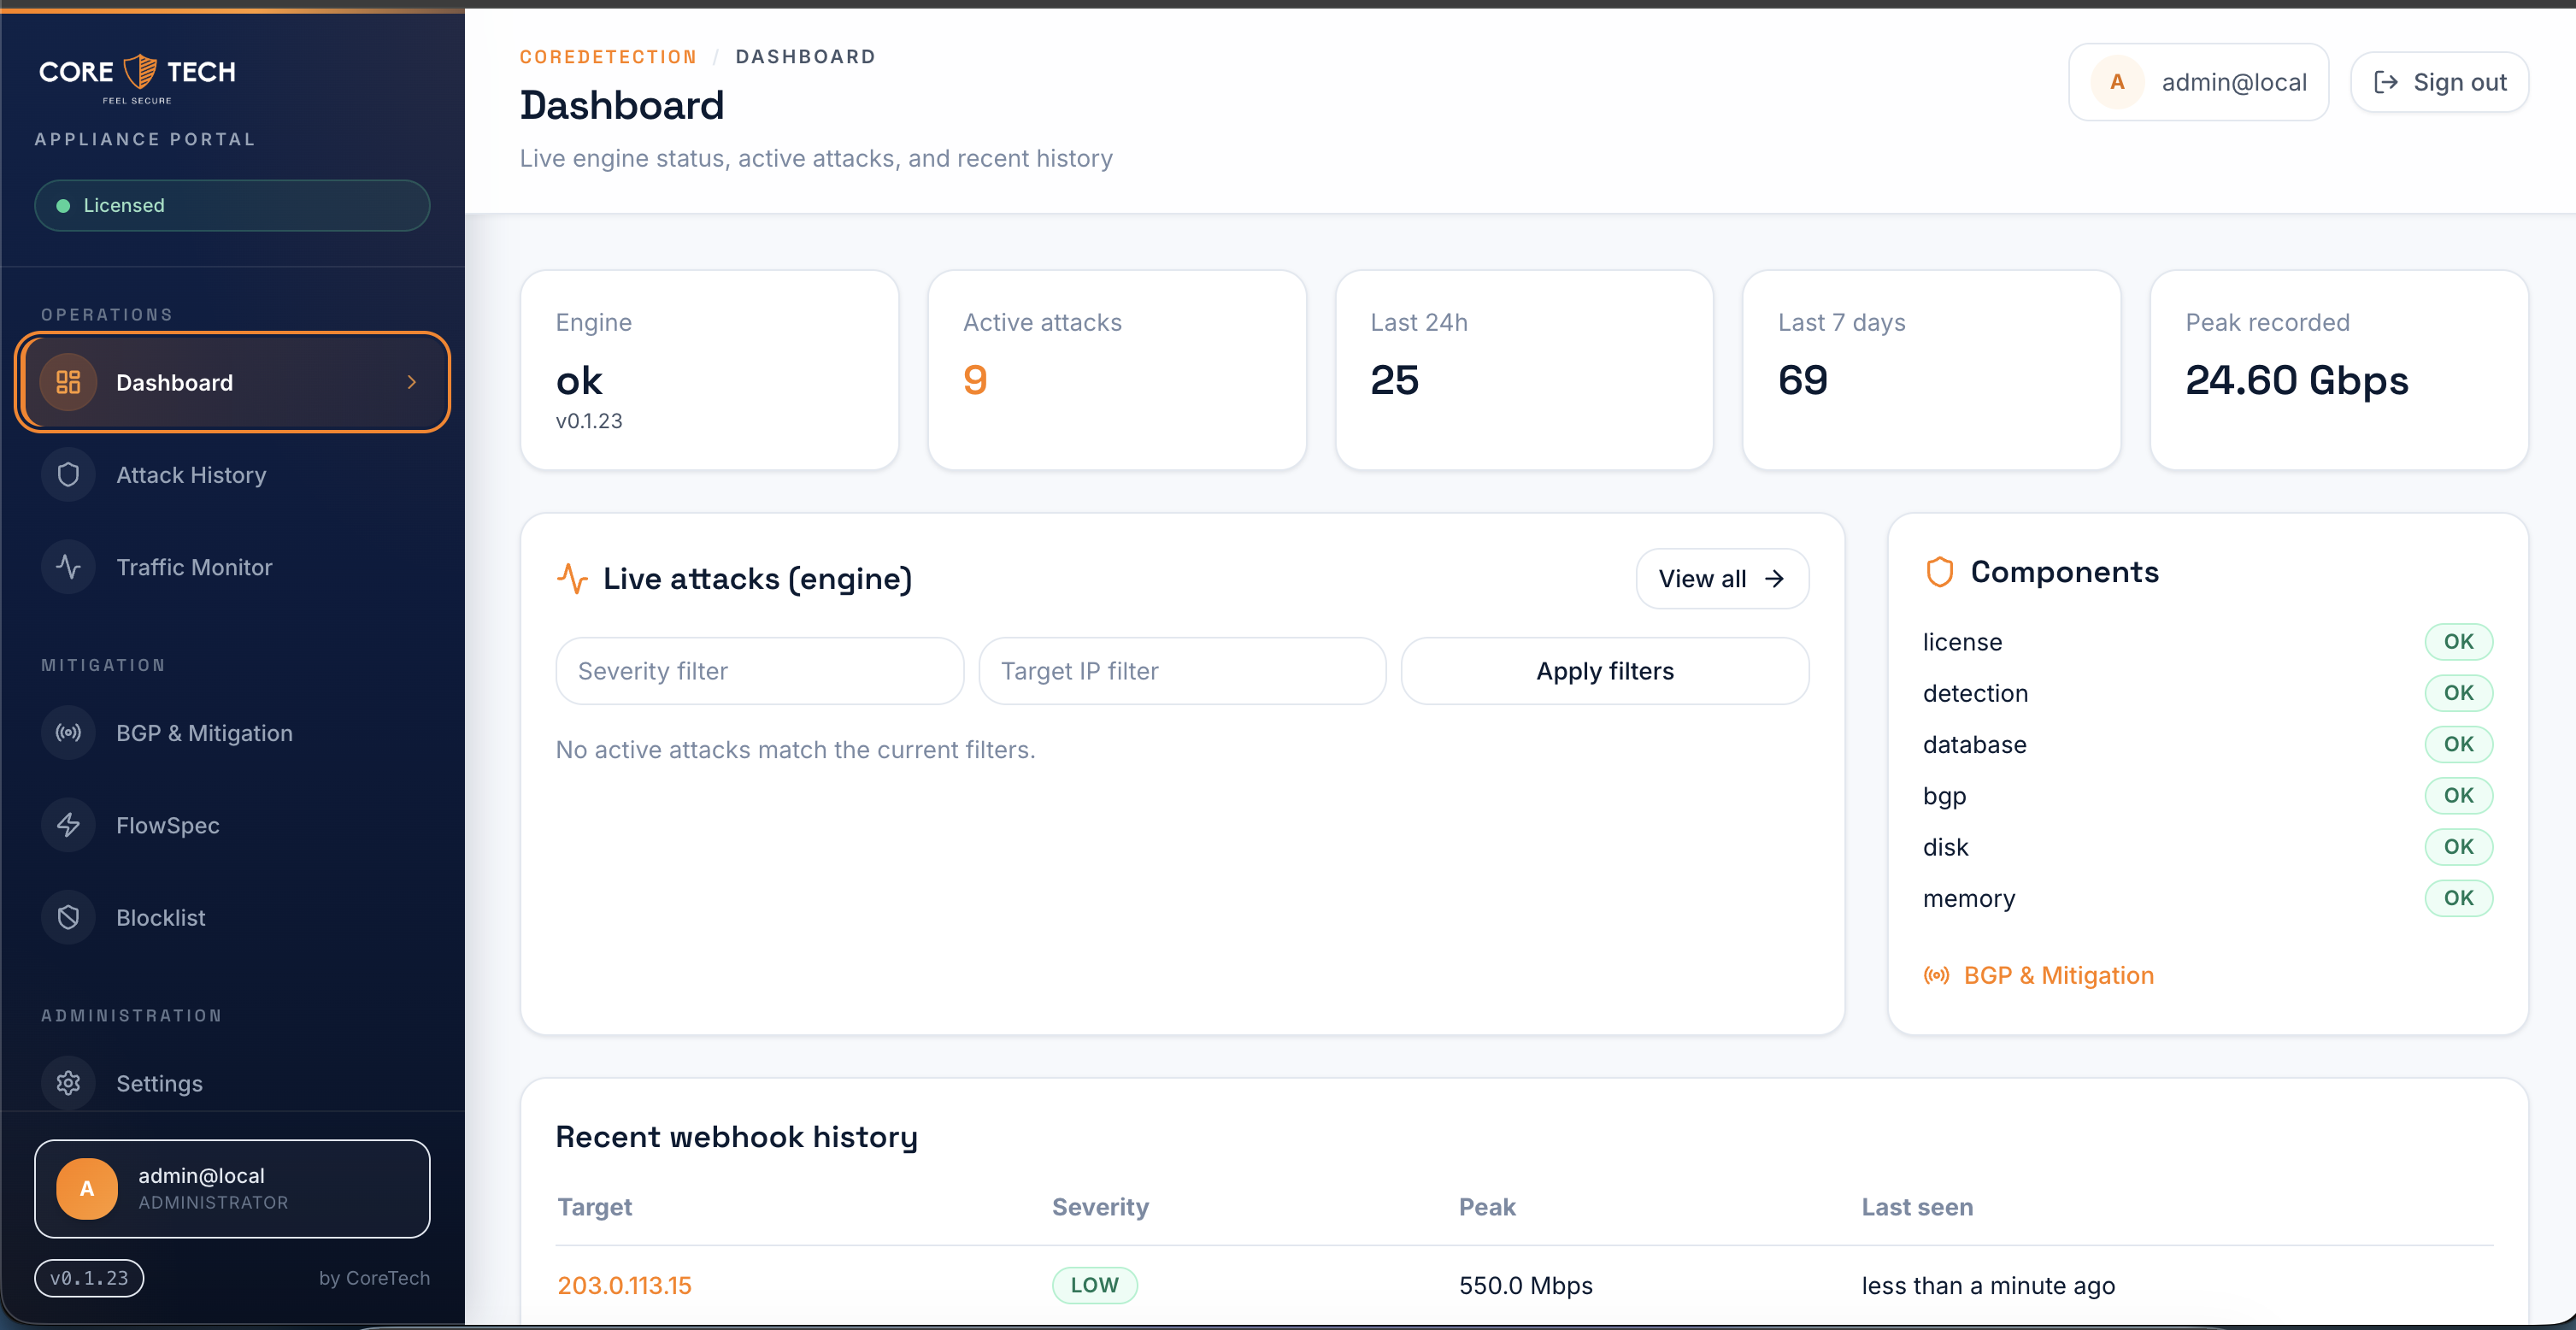
Dashboard
The home screen shows engine health, active attack count, 24h/7d totals, peak bandwidth, live attack feed, component status (license, detection, database, BGP, disk, memory), and recent webhook history.
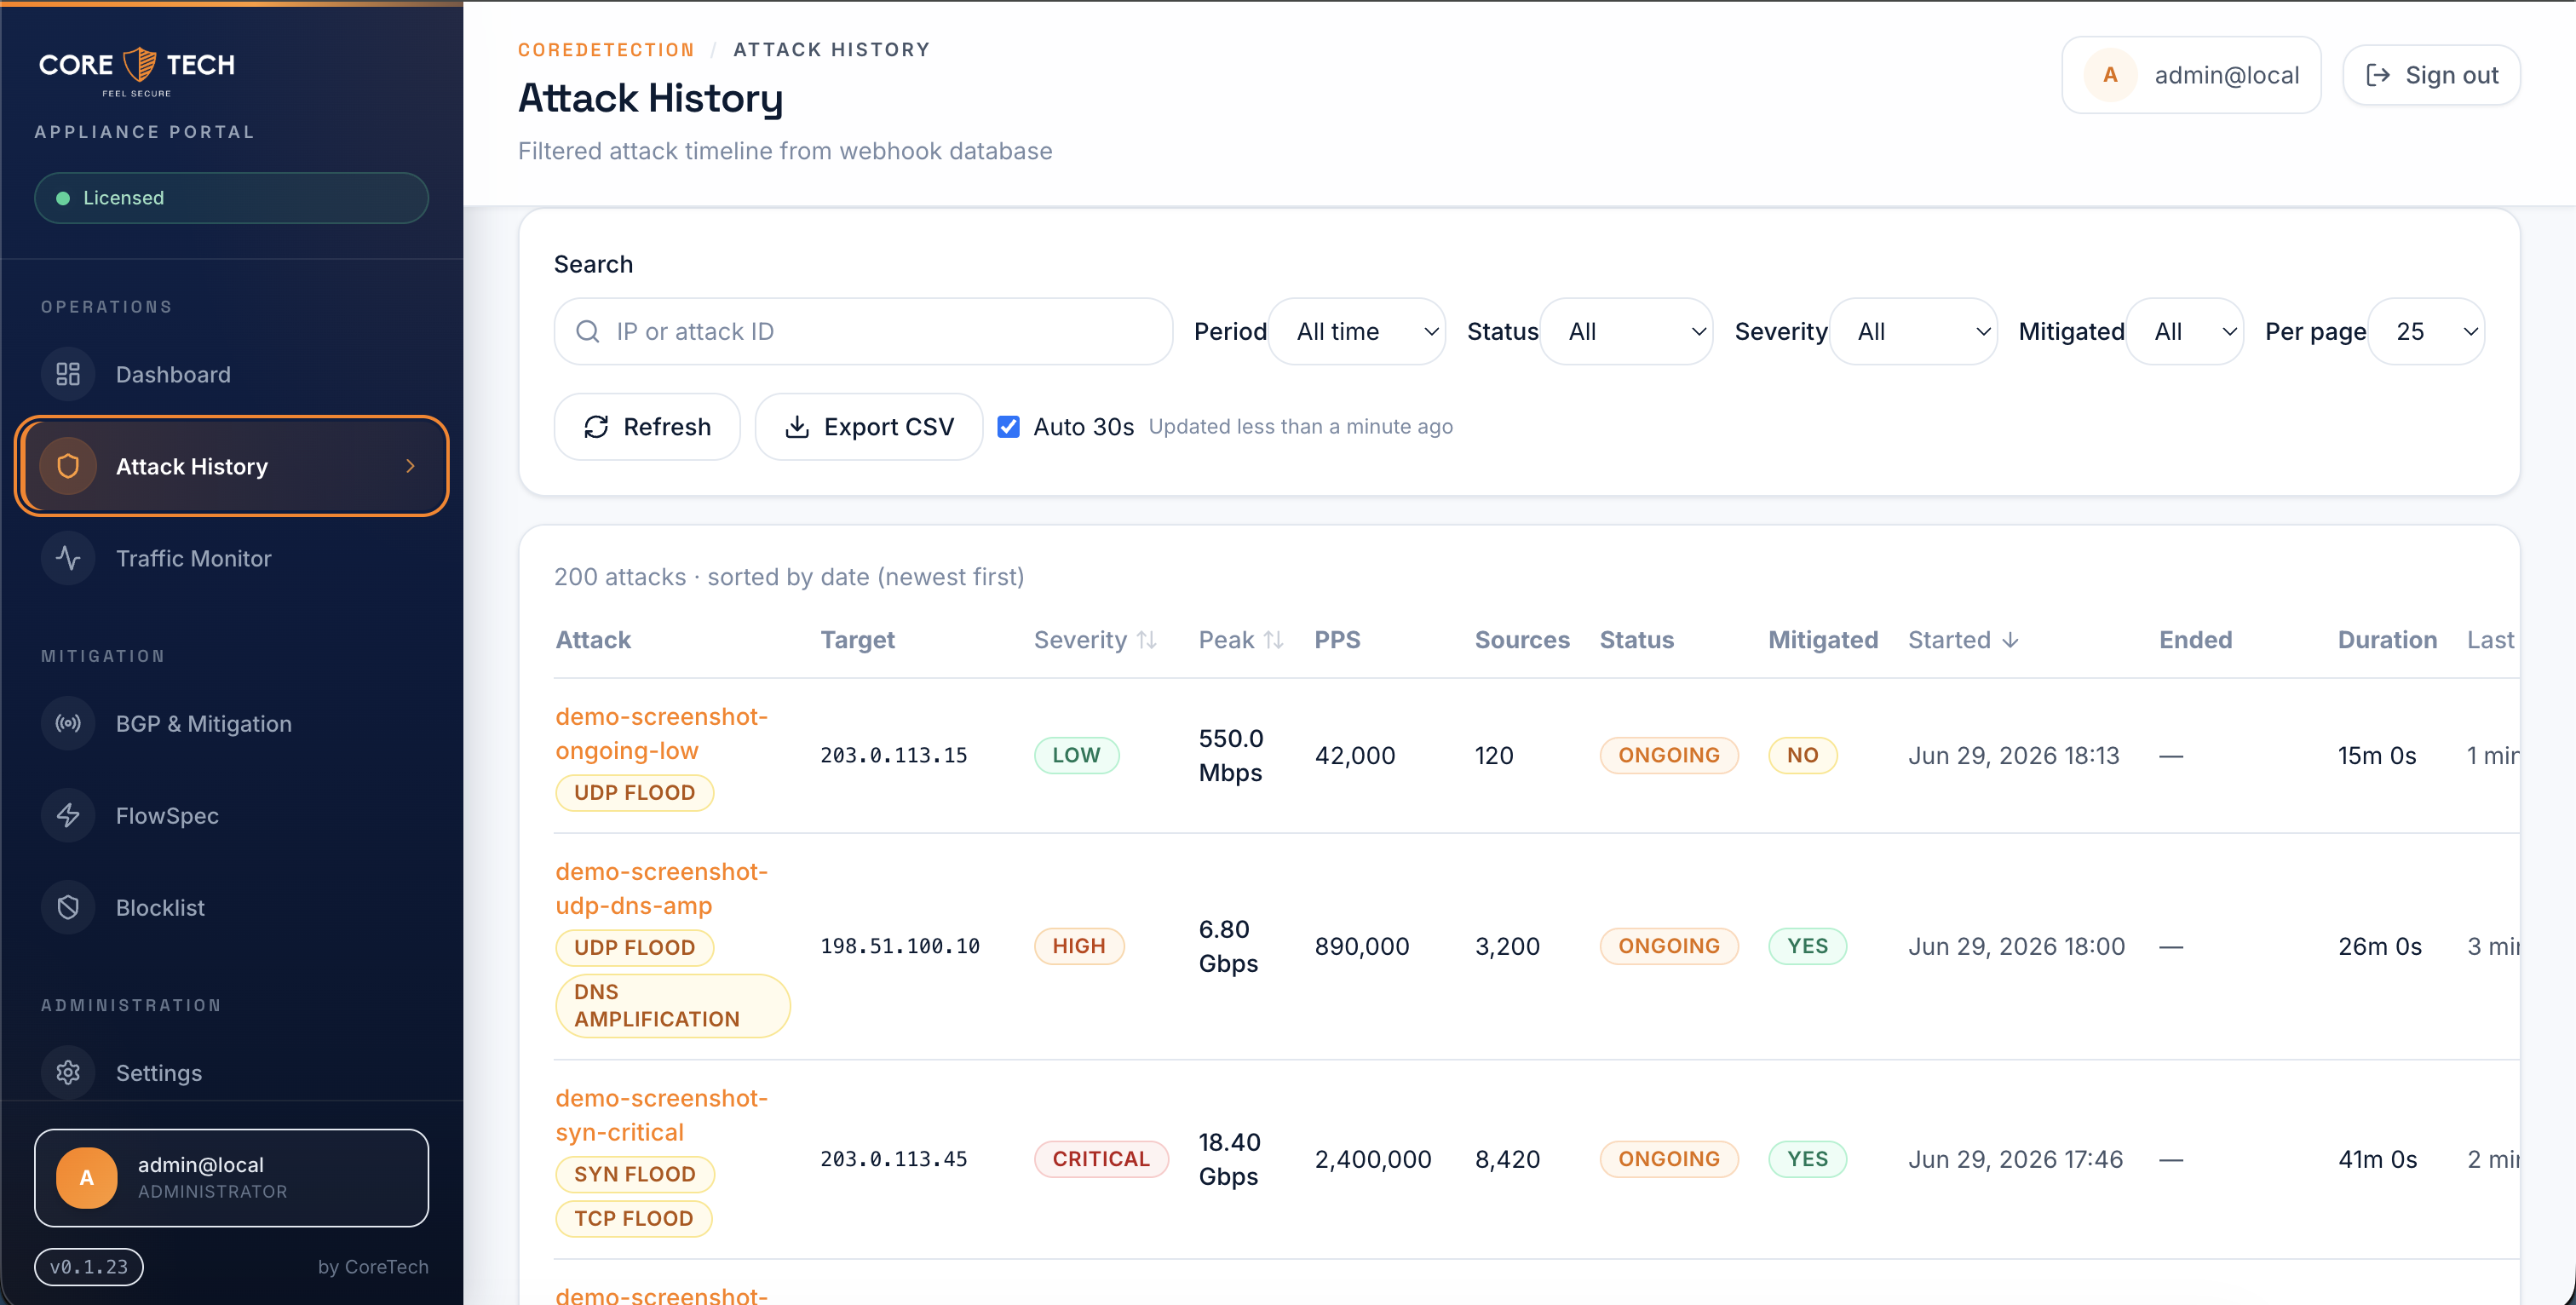
Attack History
Filterable timeline of all attacks stored in the portal database (from engine webhooks). Search by IP or attack ID, filter by period, severity, mitigation status, and export CSV.
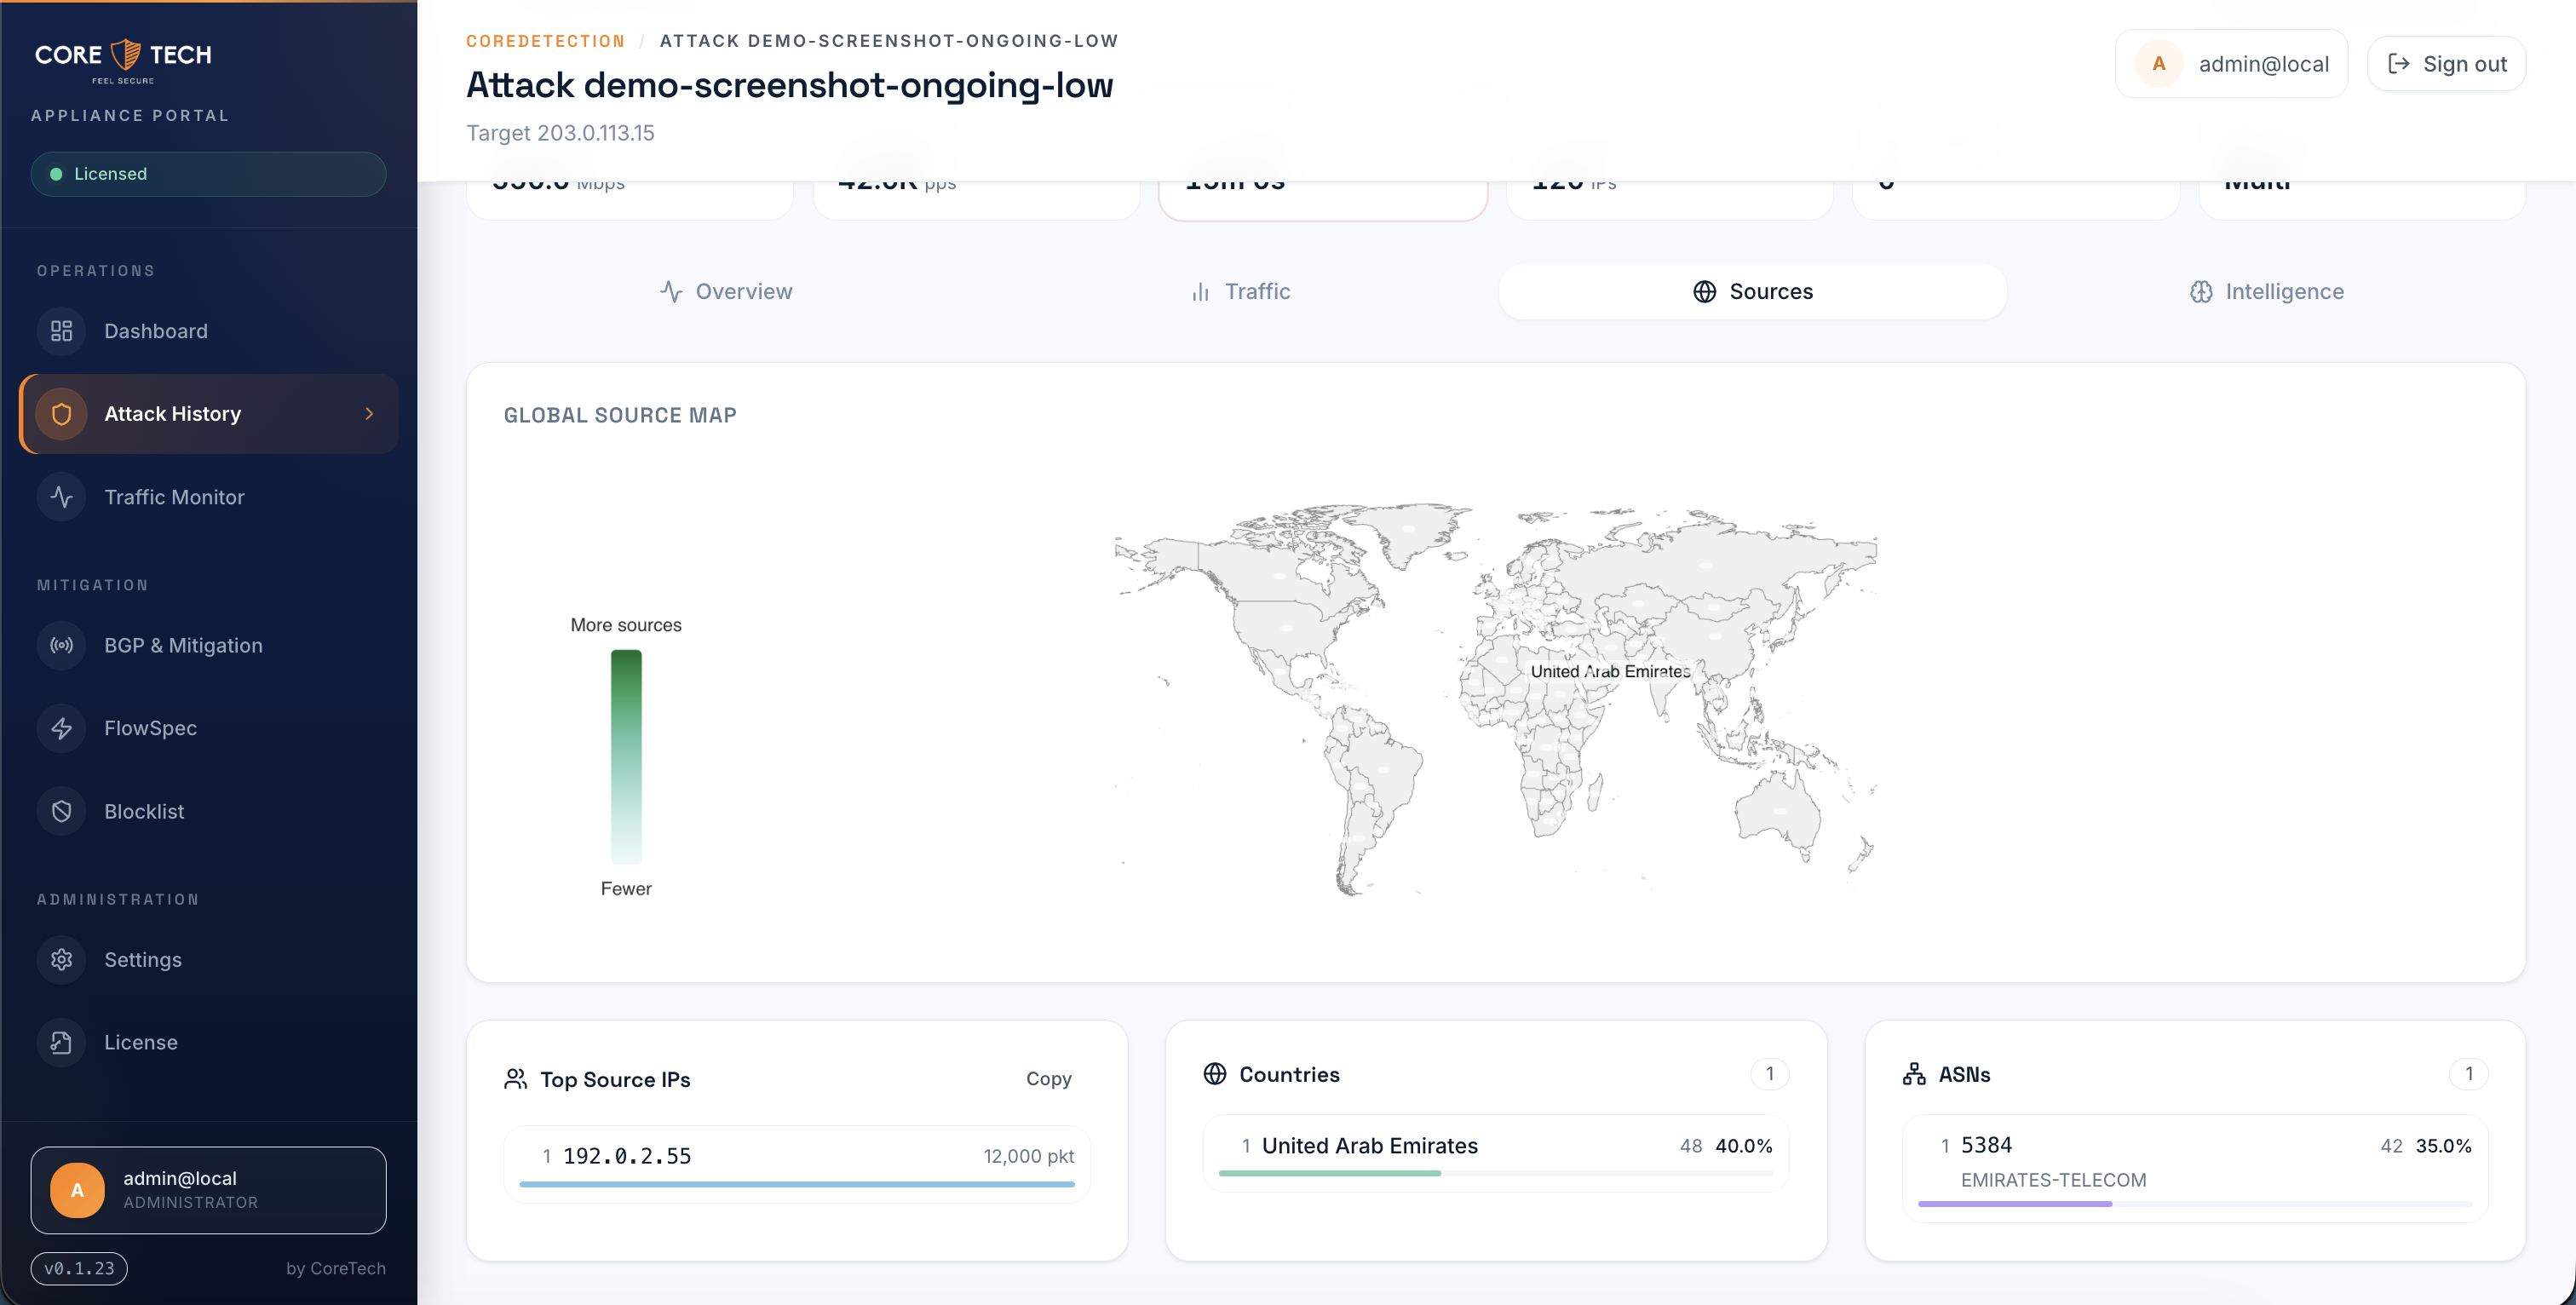
Attack detail view
Click any attack to open forensic detail: global source map, top source IPs, countries, ASNs, Smart Detection breakdown, flow samples, and mitigation metadata (including which exporter triggered the event and which BGP neighbor was selected).
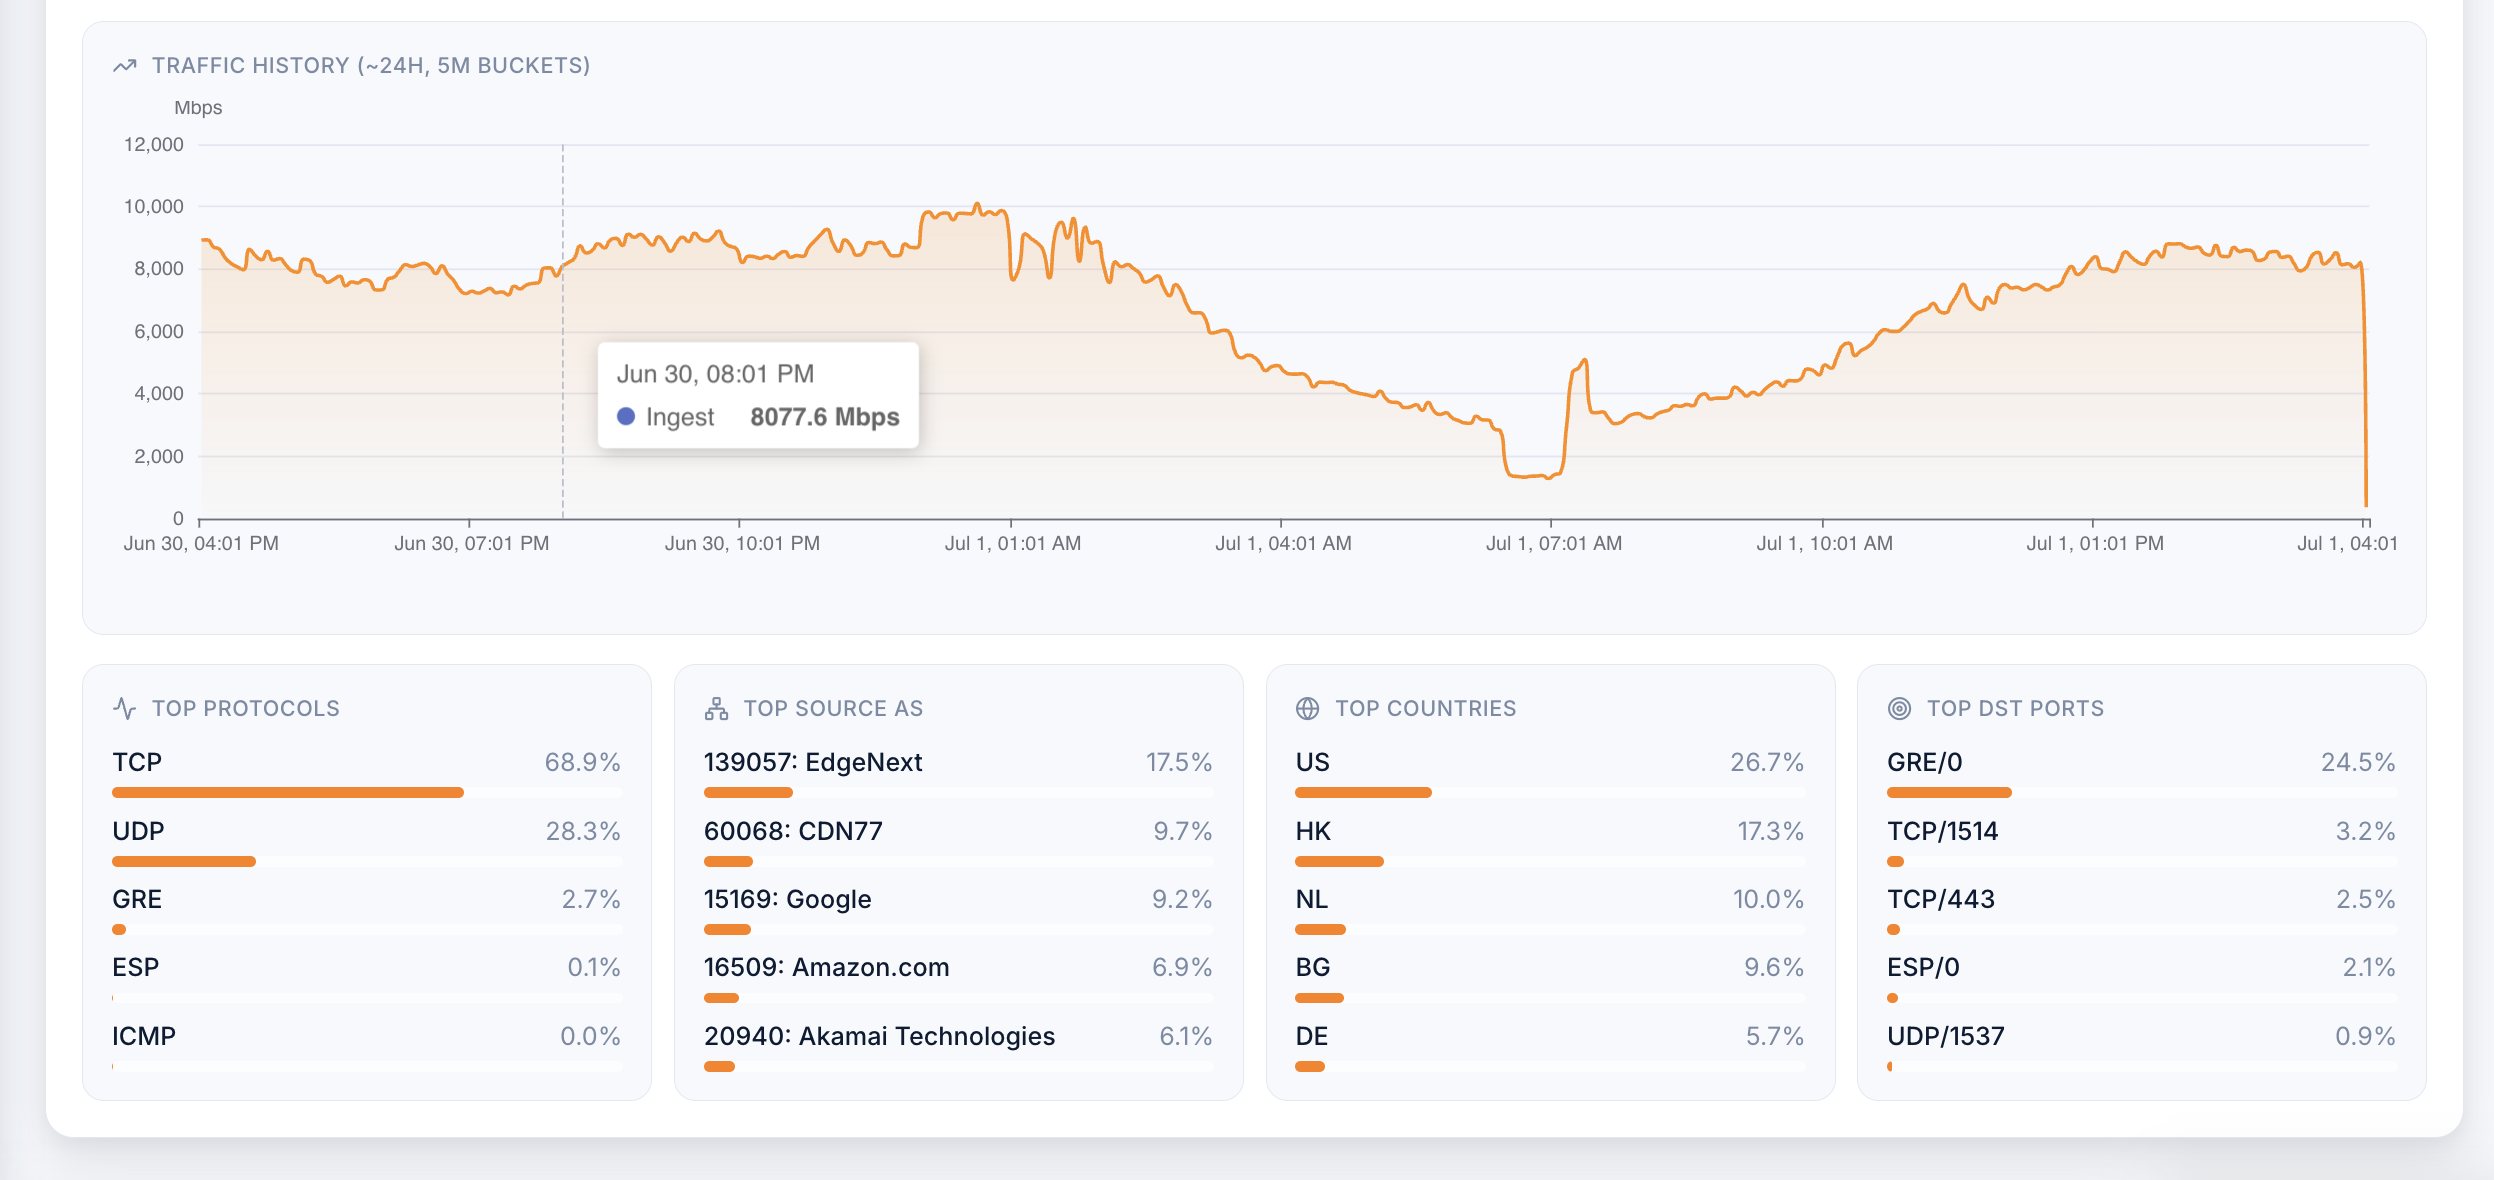
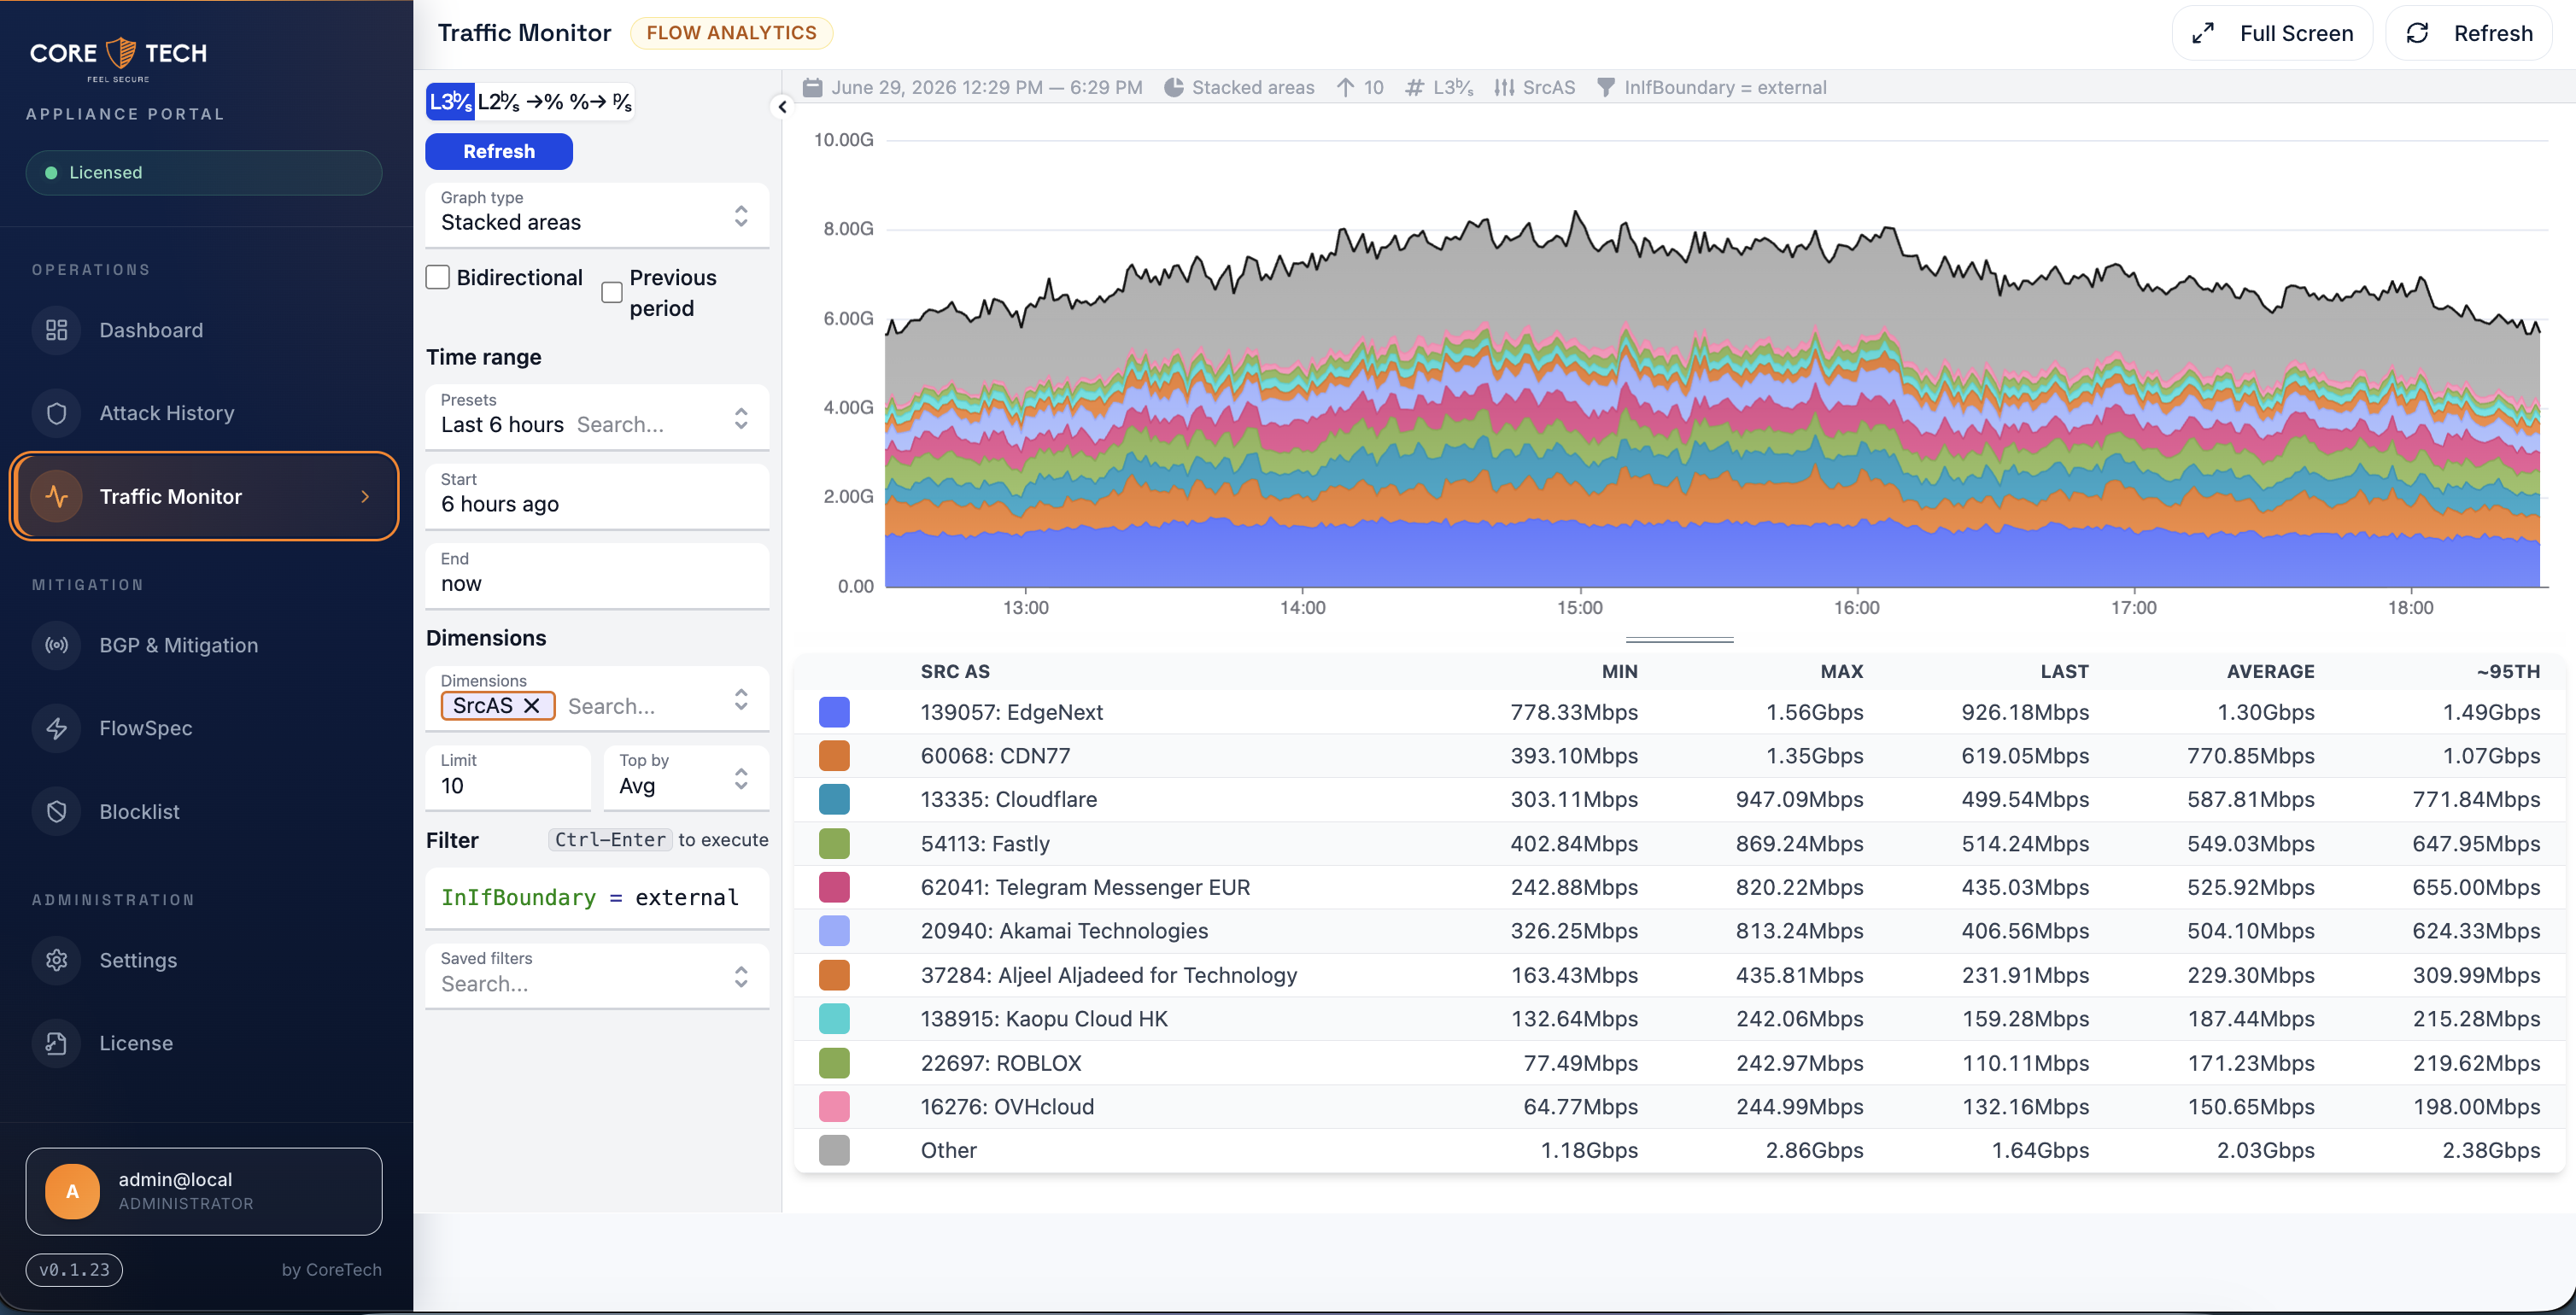
Traffic Monitor & Flow Analysis
Traffic Monitor embeds the flow analytics console (Akvorado-style) for deep drill-down: stacked area charts by SrcAS, time ranges, filter queries like InIfBoundary = external, and dimension breakdowns.
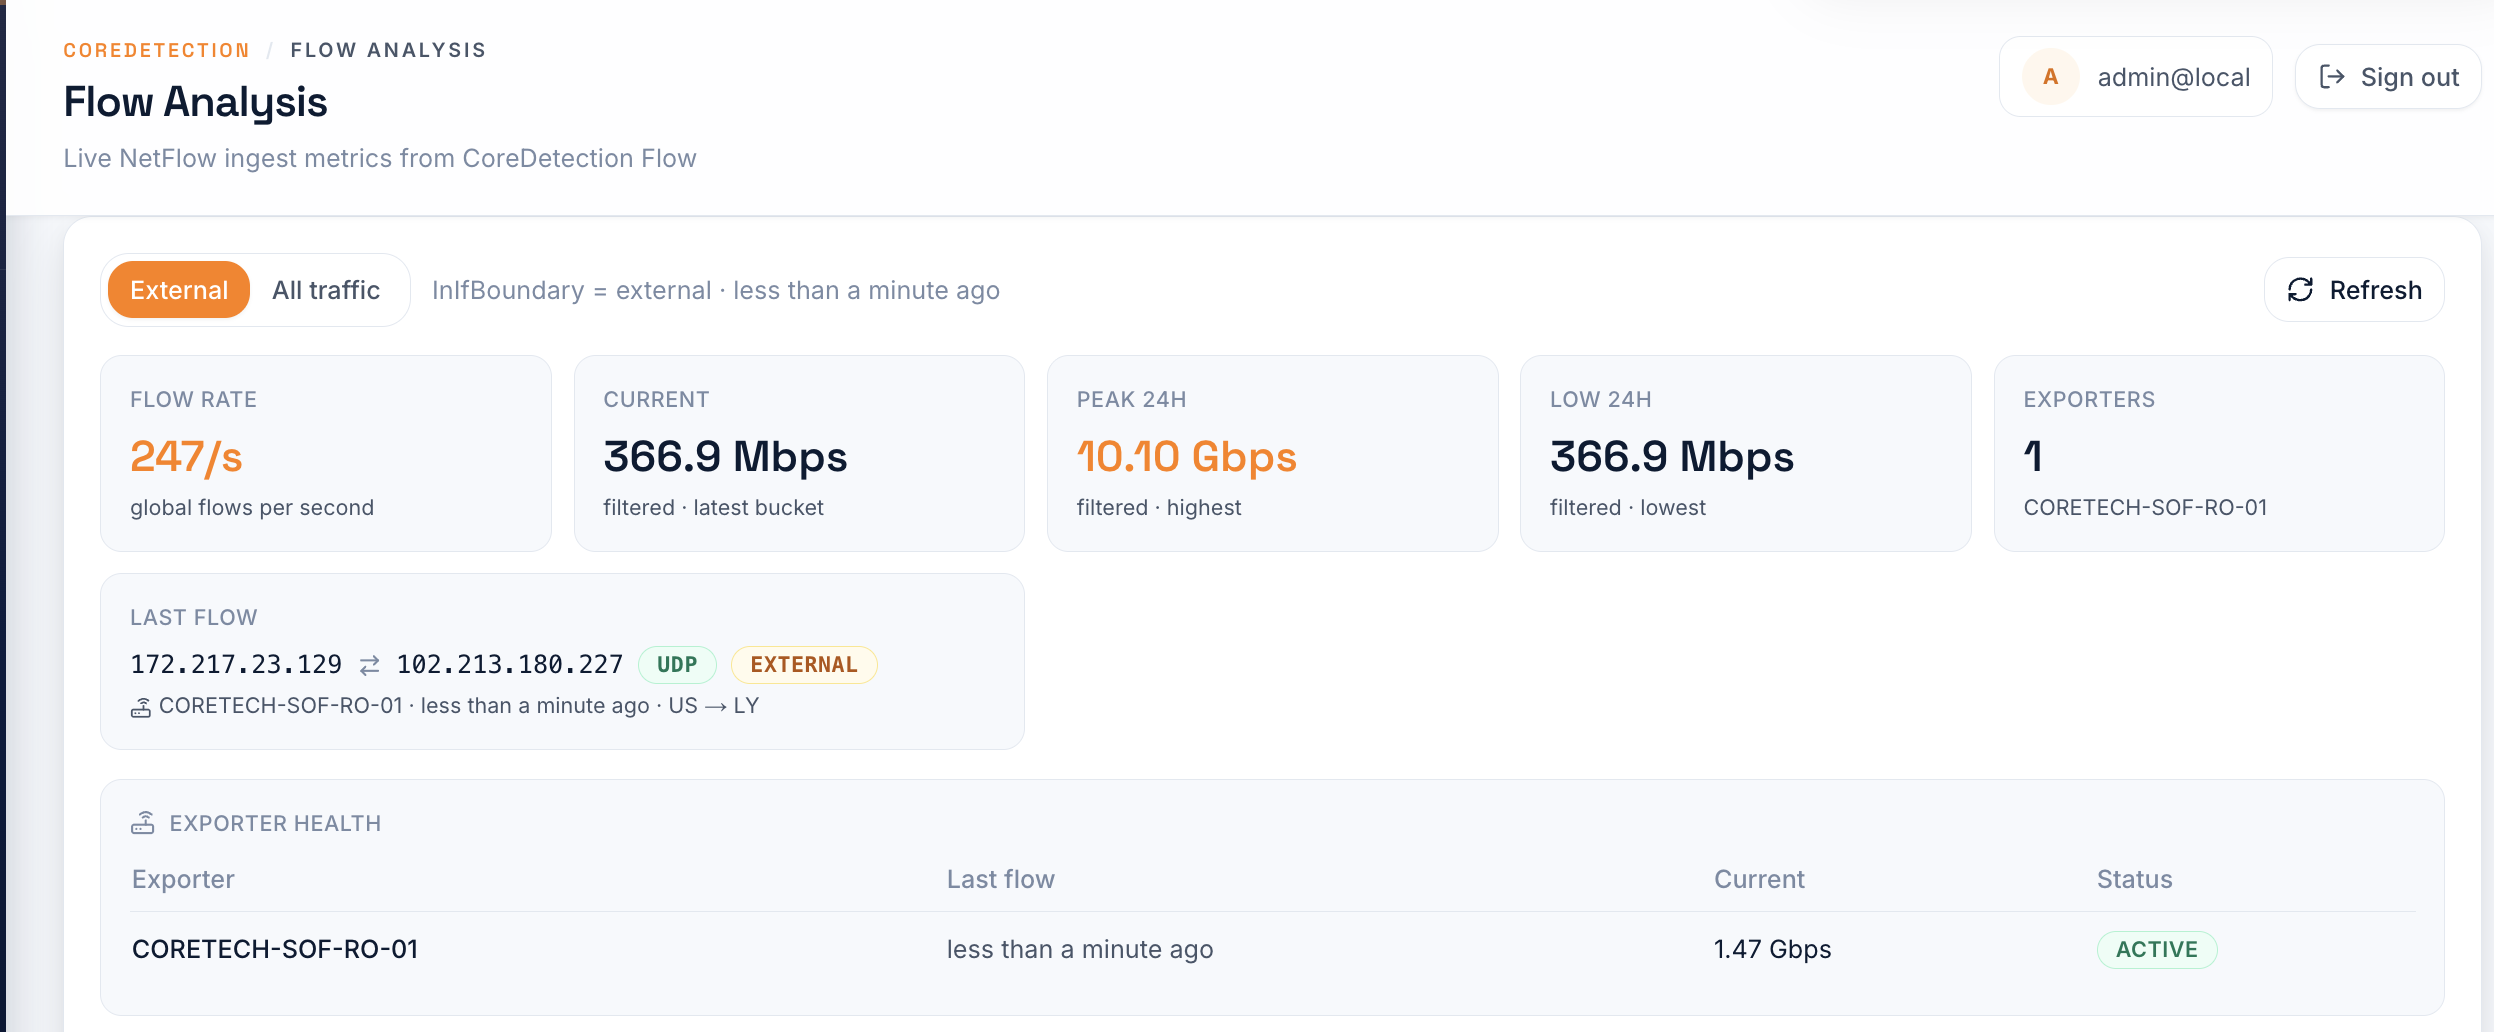
Flow Analysis (dashboard widget) shows live NetFlow ingest metrics: flow rate, current/peak bandwidth, exporter health, and last-seen flow details.
BGP & Mitigation
The BGP & Mitigation page (/bgp) is the control center for peering and selective mitigation:
| Tab | What you configure |
|---|---|
| Neighbors | Add/edit BGP peers, session state, reset sessions |
| Exporter map | Map NetFlow exporter name/IP → BGP neighbor for selective mitigation |
| Policy | Announce gates (LOW/MEDIUM/HIGH/CRITICAL), communities |
| Sessions | Live session uptime, routes sent/received |
| Manual / Attack / All routes | View and manage announced routes |
See BGP Setup → Exporter map and FlowSpec → Exporter map for how selective export works.
FlowSpec
The FlowSpec page (/flowspec) lets you enable targeted filtering, set default action (drop / rate-limit / accept / redirect / mark), add manual rules, and apply changes to BGP peers without restarting the engine.
- Automatic attack rules — exported only to neighbors resolved by the exporter map
- Manual and blocklist rules — exported to all enabled BGP peers
Blocklist
Manage threat feed ingestion and FlowSpec enforcement. Requires FlowSpec enabled on peers. See IP Blocklist guide.
Settings hubs
| Hub | Contains |
|---|---|
| Detection | Thresholds, timing, display limits, Smart Detection, trusted ASN/destinations, pseudo-L7 |
| Notifications | Telegram/email alerts, webhooks |
| System | Database, Engine API, monitoring, Appliance Update, maintenance, debug |
| Expert | Raw config.ini editor with secret masking, engine restart, live logs |
Appliance Update
Settings → System → Updates compares installed versions (Detection Engine, Flow Engine, Portal) against latest.json and installs the published bundle with one click. See Installation → Updates.
Config Editor (Expert)
Settings → Expert shows a readable JSON view of the live engine config (secrets redacted), or edit config.ini directly with validation and one-click engine restart.
License
Settings → License displays the Server ID, license upload, and Enable detection button. See Installation → After install.
How the portal talks to the engine
Browser requests go to /api/proxy/… on the portal. The portal injects the engine API key server-side and forwards to localhost:9009/CoreDetection/api/v0/…. This keeps your API key off client machines.
Next steps
- BGP Setup — peering, exporter map, reconciliation
- BGP FlowSpec — targeted filtering rules
- Configuration reference
- REST API reference